
Send OpenTelemetry signals directly to Keboola Storage
Send logs, metrics, and traces from any OpenTelemetry SDK or collector into Keboola Storage. Once there, query them alongside your business data in the same SQL you already use.
OpenTelemetry (OTLP) is now a source type in Data Streams. Choose it when creating a stream and your telemetry lands in Storage as queryable tables. No changes to existing HTTP streams.
What's different
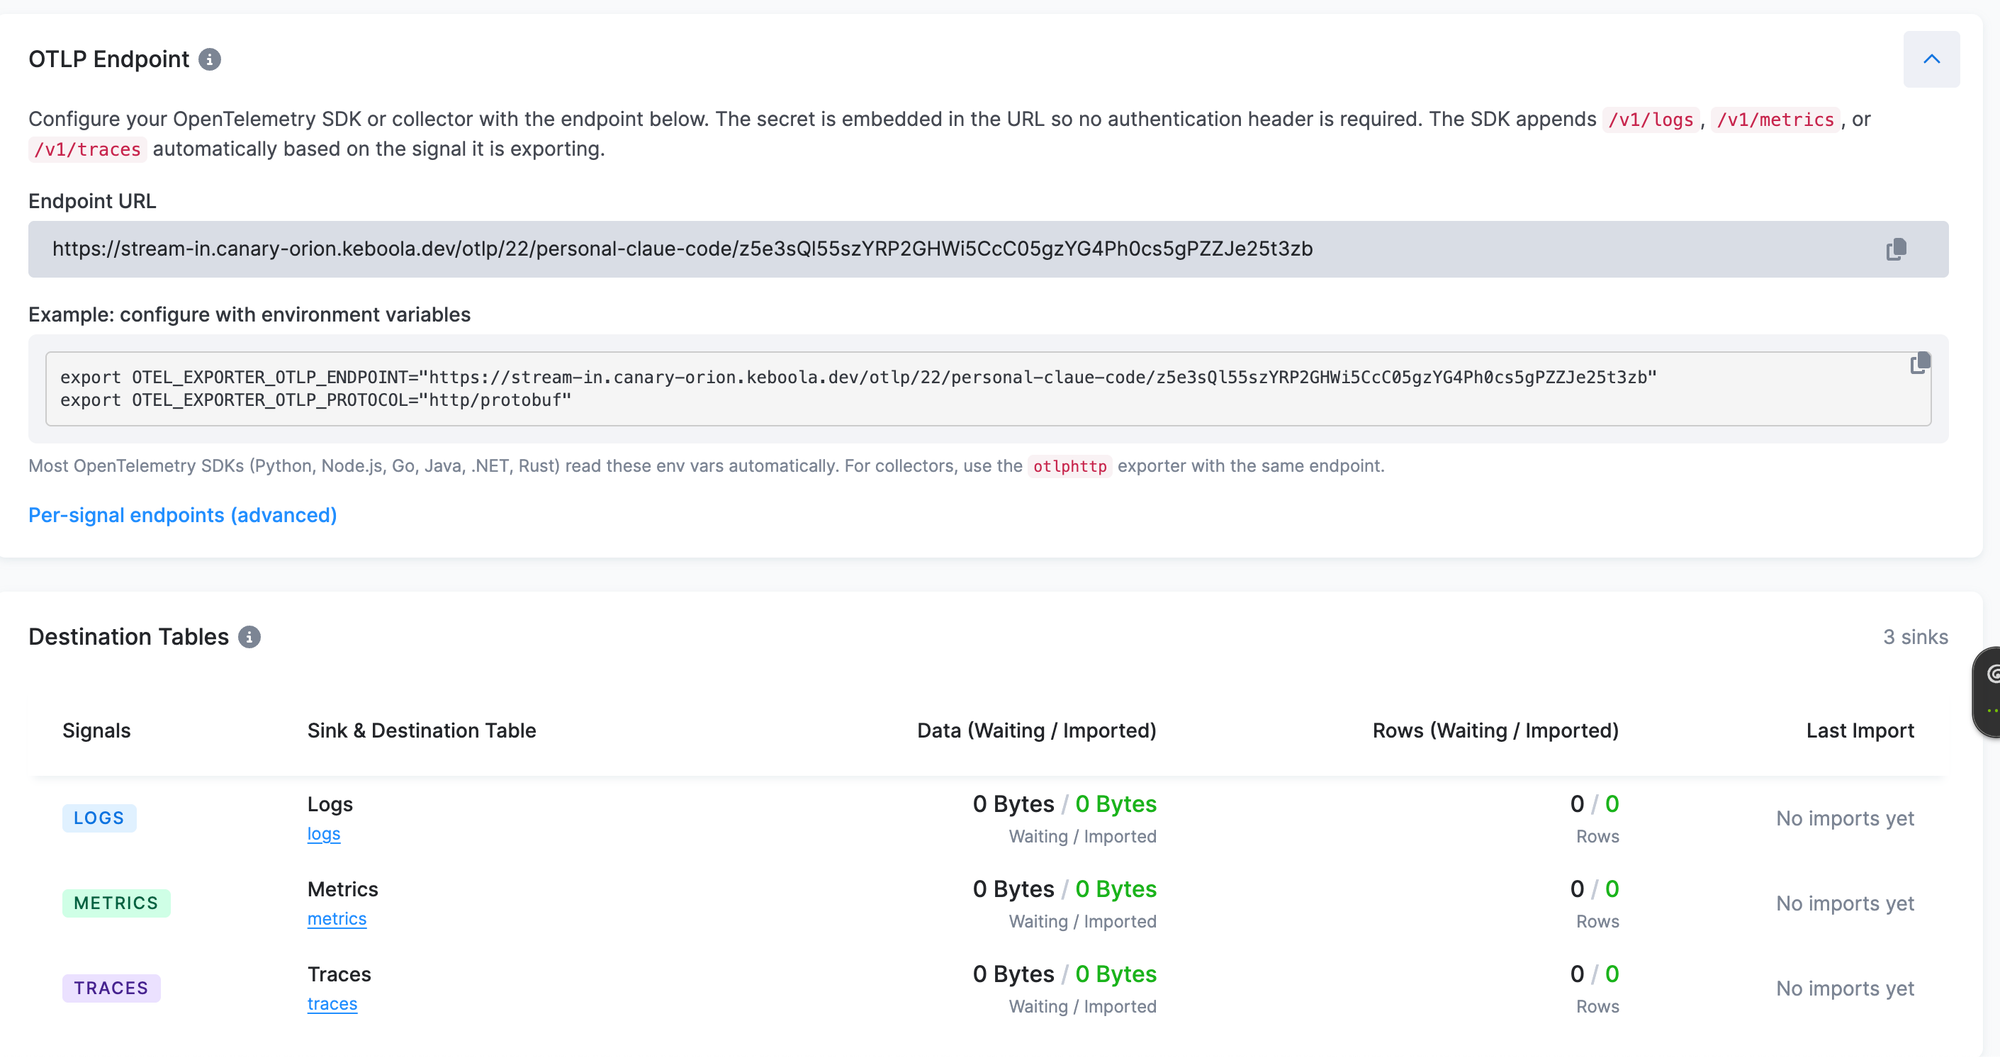
Choosing OTLP creates three destination tables automatically: logs, metrics, traces. Fields like service, severity, trace_id, host_name, k8s_pod_name, and deployment_environment land as top-level columns rather than inside a JSON blob. Raw payload available as opt-in.
To connect any SDK or collector, set two environment variables:
export OTEL_EXPORTER_OTLP_ENDPOINT="<your-stream-endpoint>"
export OTEL_EXPORTER_OTLP_PROTOCOL="http/protobuf"
Python, Node.js, Go, Java, .NET, and Rust SDKs pick these up automatically. The endpoint and a ready-to-paste snippet are on the source detail page.
Why
Telemetry data usually lives in a separate monitoring tool. Connecting it to business data (orders, sessions, conversions) means building a custom export pipeline. With telemetry in Storage, it's a join.
To try it
- Storage > Data Streams → Create Data Stream
- Choose OpenTelemetry (OTLP)
- Copy the endpoint from the source detail page
- Set the two environment variables
Disclaimer: Data Streams must be enabled on your project first. If you don't have it yet, contact support to request access.
Whether you're consolidating application observability with business data, correlating service latency with pipeline performance, or tracking LLM agent activity without a dedicated collector: the telemetry is yours to query.
Questions or feedback? Submit a support ticket.