Visualize Your Data Pipelines
Keboola now renders Mermaid diagrams in project descriptions, configuration descriptions, and Kai chat. Kai can generate them for you.

Where you'll see diagrams
In Kai chat
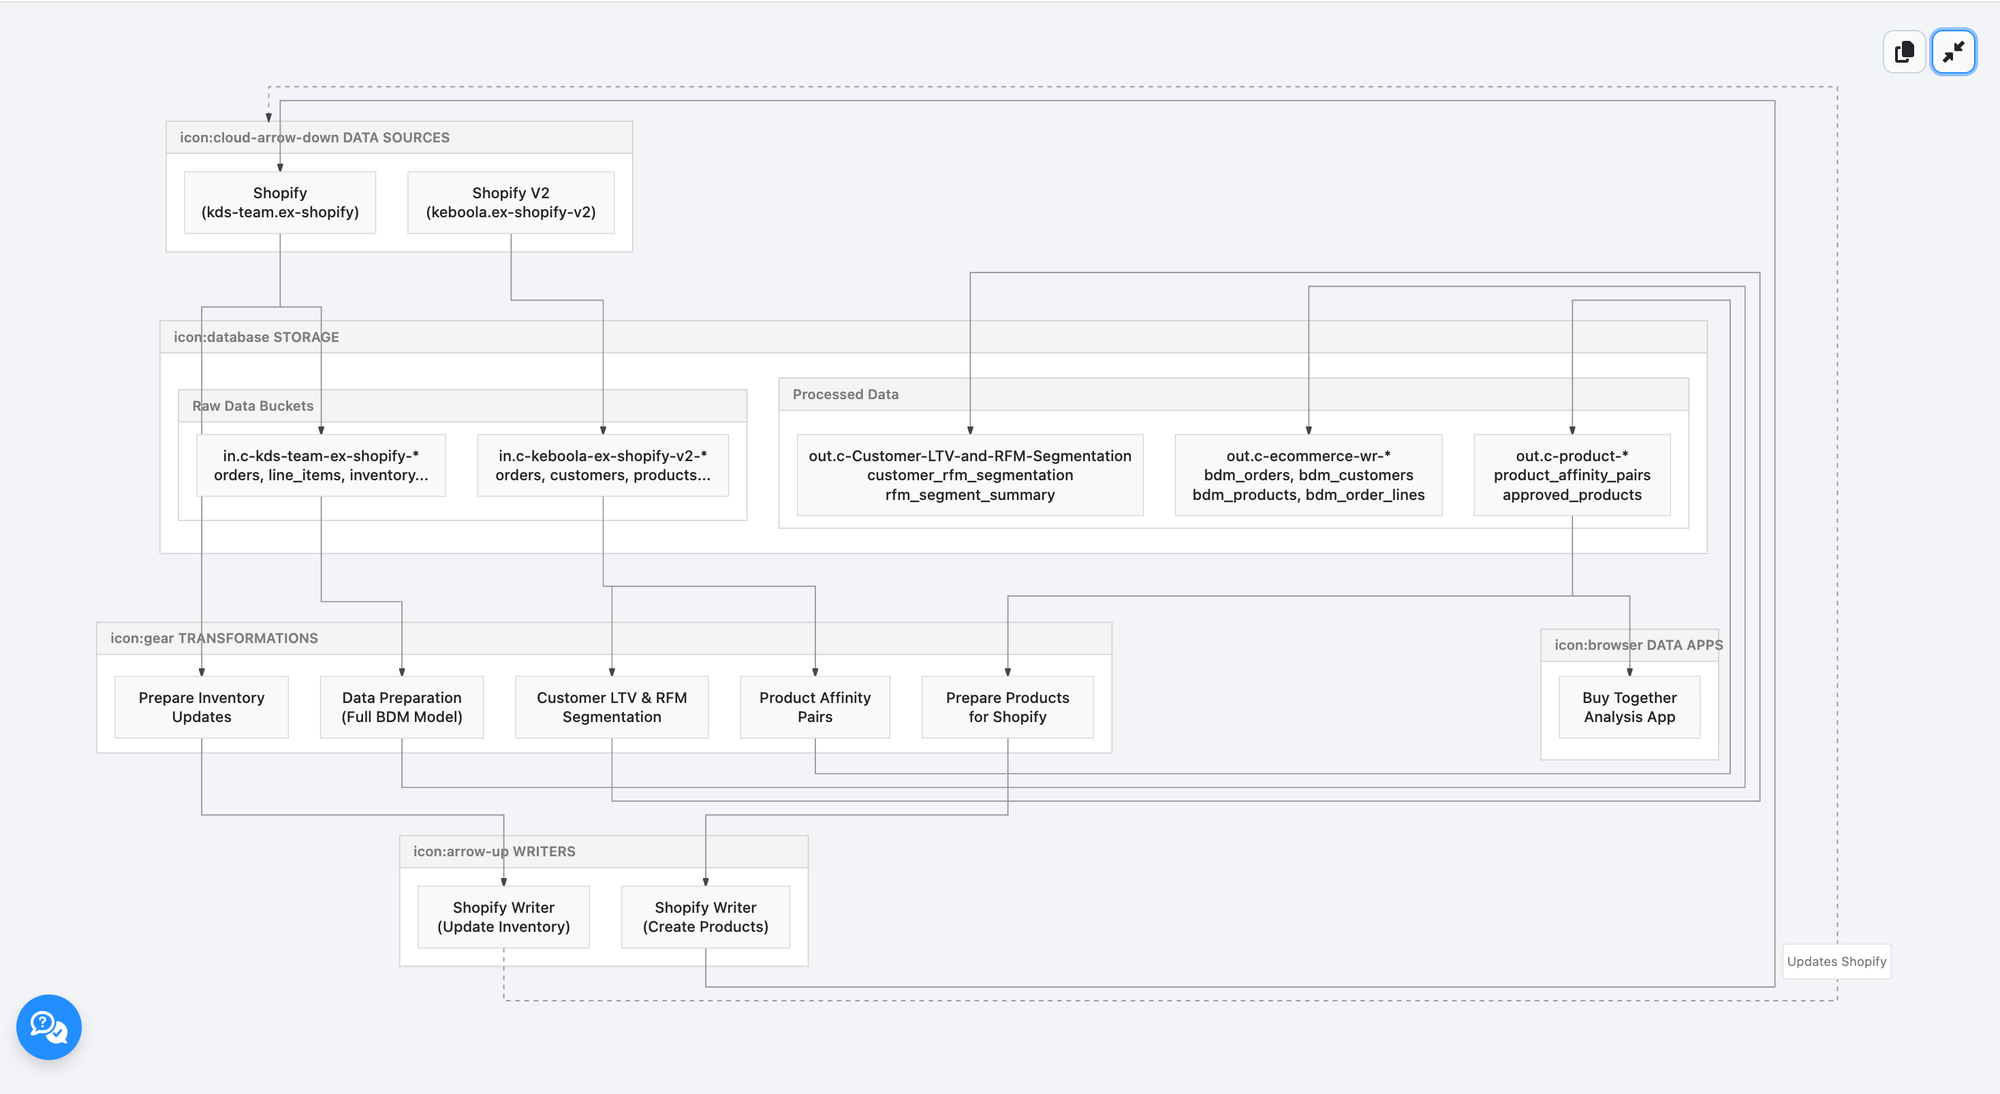
Ask Kai to visualize a data flow, map dependencies, or explain a process. You get a rendered diagram instead of text.
Example: "Show me how data flows through this project"
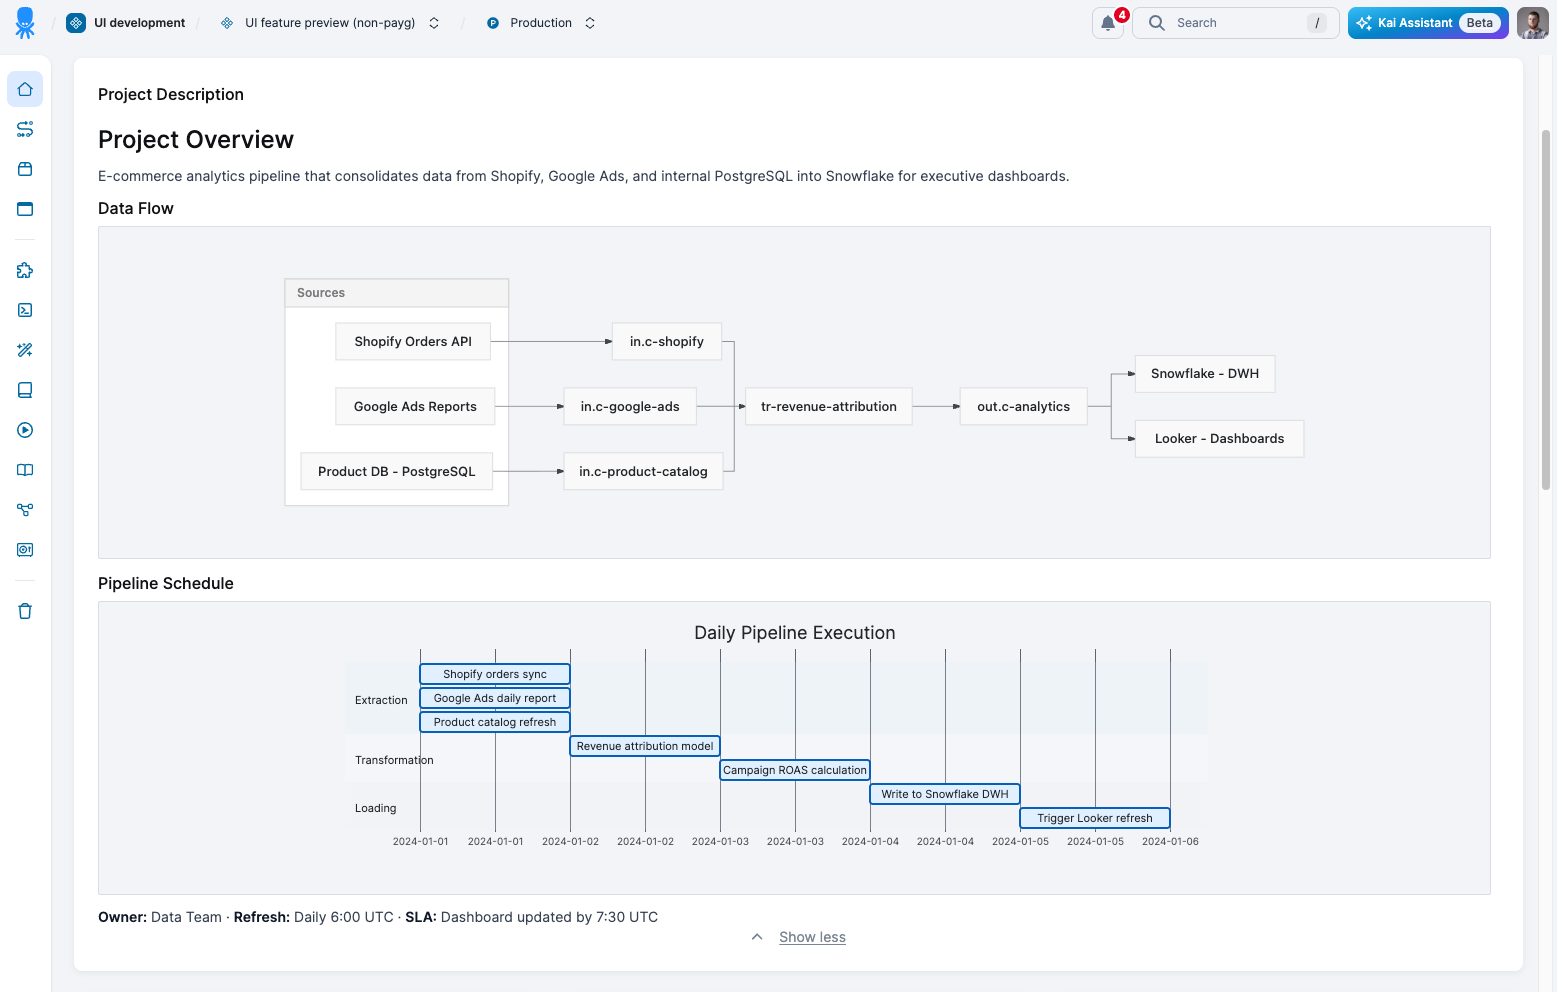
In project descriptions
Ask Kai to add a diagram to your project or configuration description. Anyone opening it sees a visual instead of text.
Example: "Add a diagram to this project's description explaining the pipeline"
What you can build
Flowcharts, sequence diagrams, ER diagrams, Gantt charts, state diagrams, class diagrams, pie charts, and mindmaps.
Diagram controls
- Zoom with Cmd+scroll
- Pan by dragging
- Fullscreen mode
- Copy Mermaid source with one click
Why this matters
Visual documentation is easier to understand and faster to onboard with. Kai generates diagrams instantly, so you don't need to learn Mermaid syntax or build them manually.