Telemetry Dashboards — Rebuilt from Scratch on Keboola Data Apps
We've completely rebuilt the telemetry dashboards that help you understand your Keboola usage. Instead of relying on a third-party visualization tool, everything now runs natively on Keboola Python/JS Data Apps — giving us full control to improve the experience and ship new features faster.
New dashboards will be available starting Monday, March 30, 2026.
Why We Made the Switch
The previous dashboards were built on a third-party reporting tool. They worked, but every improvement we wanted to make — a new chart, a different filter, a custom drill-down — required working within that tool's constraints. We hit limitations on customization, had an external dependency in our critical path, and the cost profile didn't scale well.
By rebuilding on our own Data Apps platform, we get:
- Unlimited customization — every pixel, every interaction, every data transformation is ours to control
- No external dependencies — the dashboards run entirely within Keboola infrastructure
- A smarter cost profile — no third-party licensing fees, and smart caching minimizes data warehouse queries
- Faster iteration — new features ship when they're ready, not when a vendor's roadmap allows
We're essentially dogfooding our own product here. If we can run a full-featured analytics platform on Python/JS Data Apps — with interactive charts, drill-downs, server-side pagination, and real-time filtering — imagine what you can build.
What's in the Dashboards
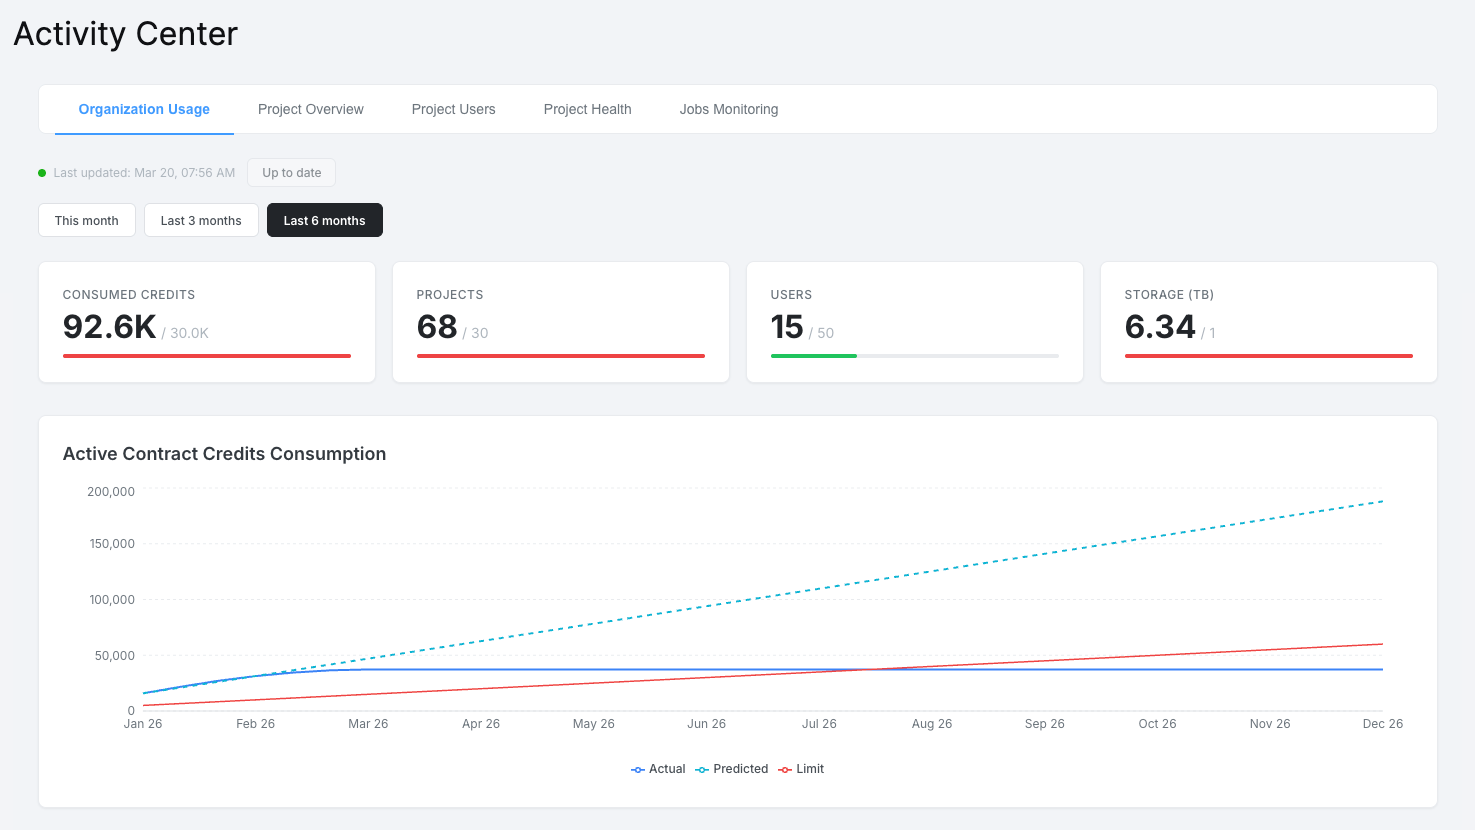
All telemetry dashboards have been rebuilt on the new platform — including the Activity Center, which provides organization-wide visibility across five tabs:
- Organization Usage — contract consumption tracking with PPU credits, storage, projects, and users against your contract limits
- Project Overview — credits breakdown by component, top transformations, outlier detection across all your projects
- Project Users — user activity trends, MFA adoption, workspace usage, and per-user consumption details
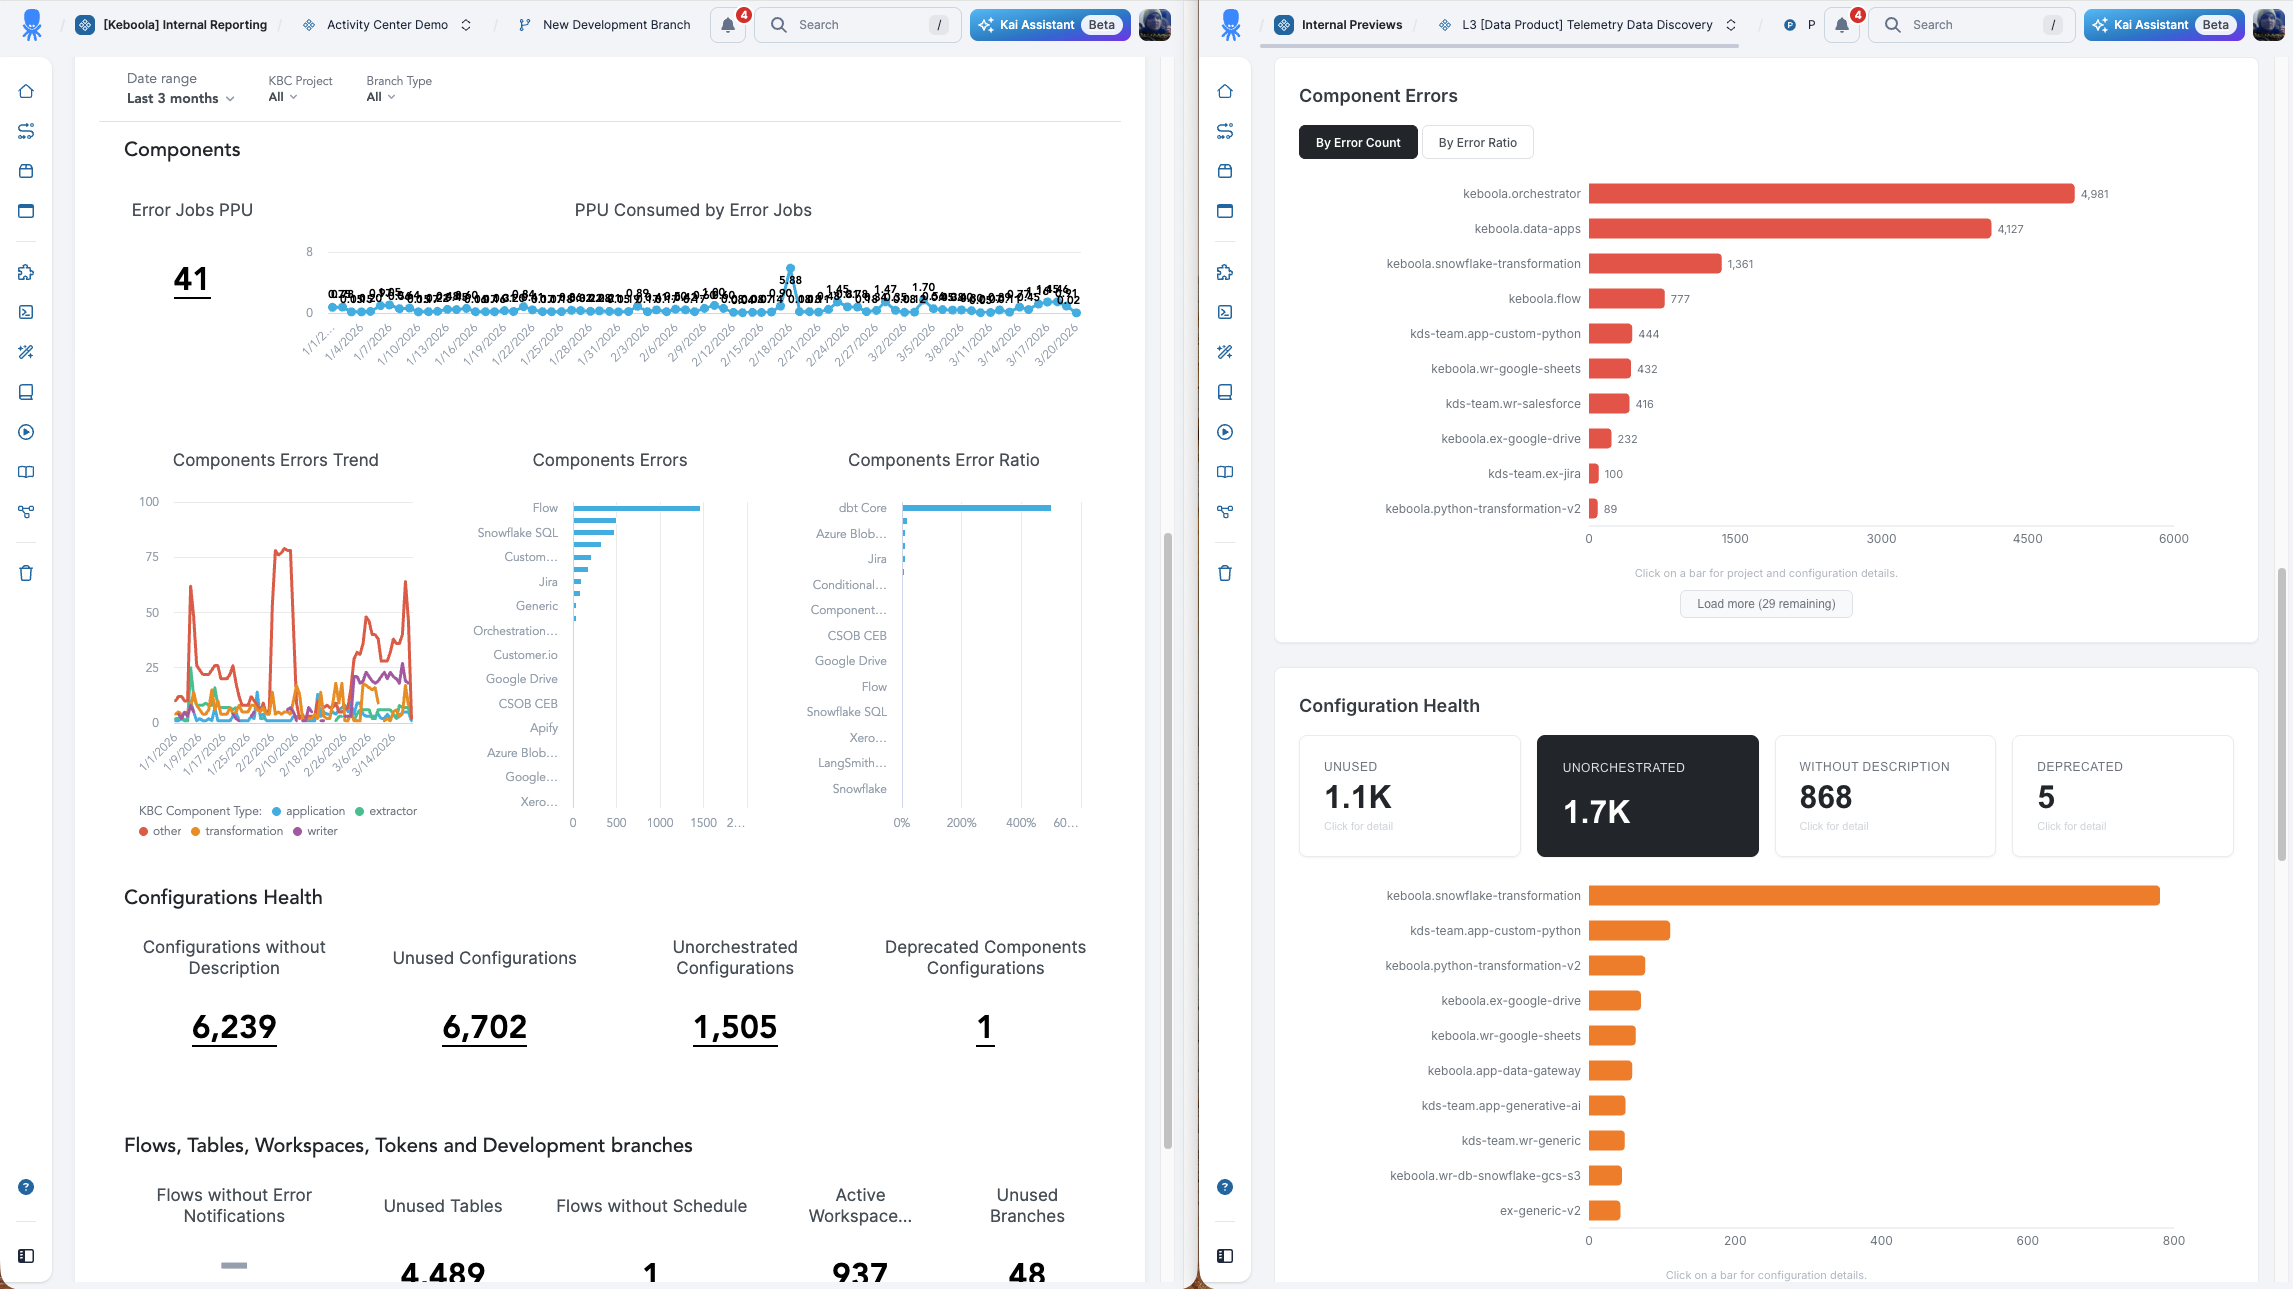
- Project Health — job and flow error rates, component error analysis, configuration hygiene scoring
- Jobs Monitoring — individual job records with server-side filtering, sorting, and pagination across your entire organization
Please note that the Activity Center dashboard is part of a paid feature and is not available to all users. If you are interested in using this feature, please contact your account manager.
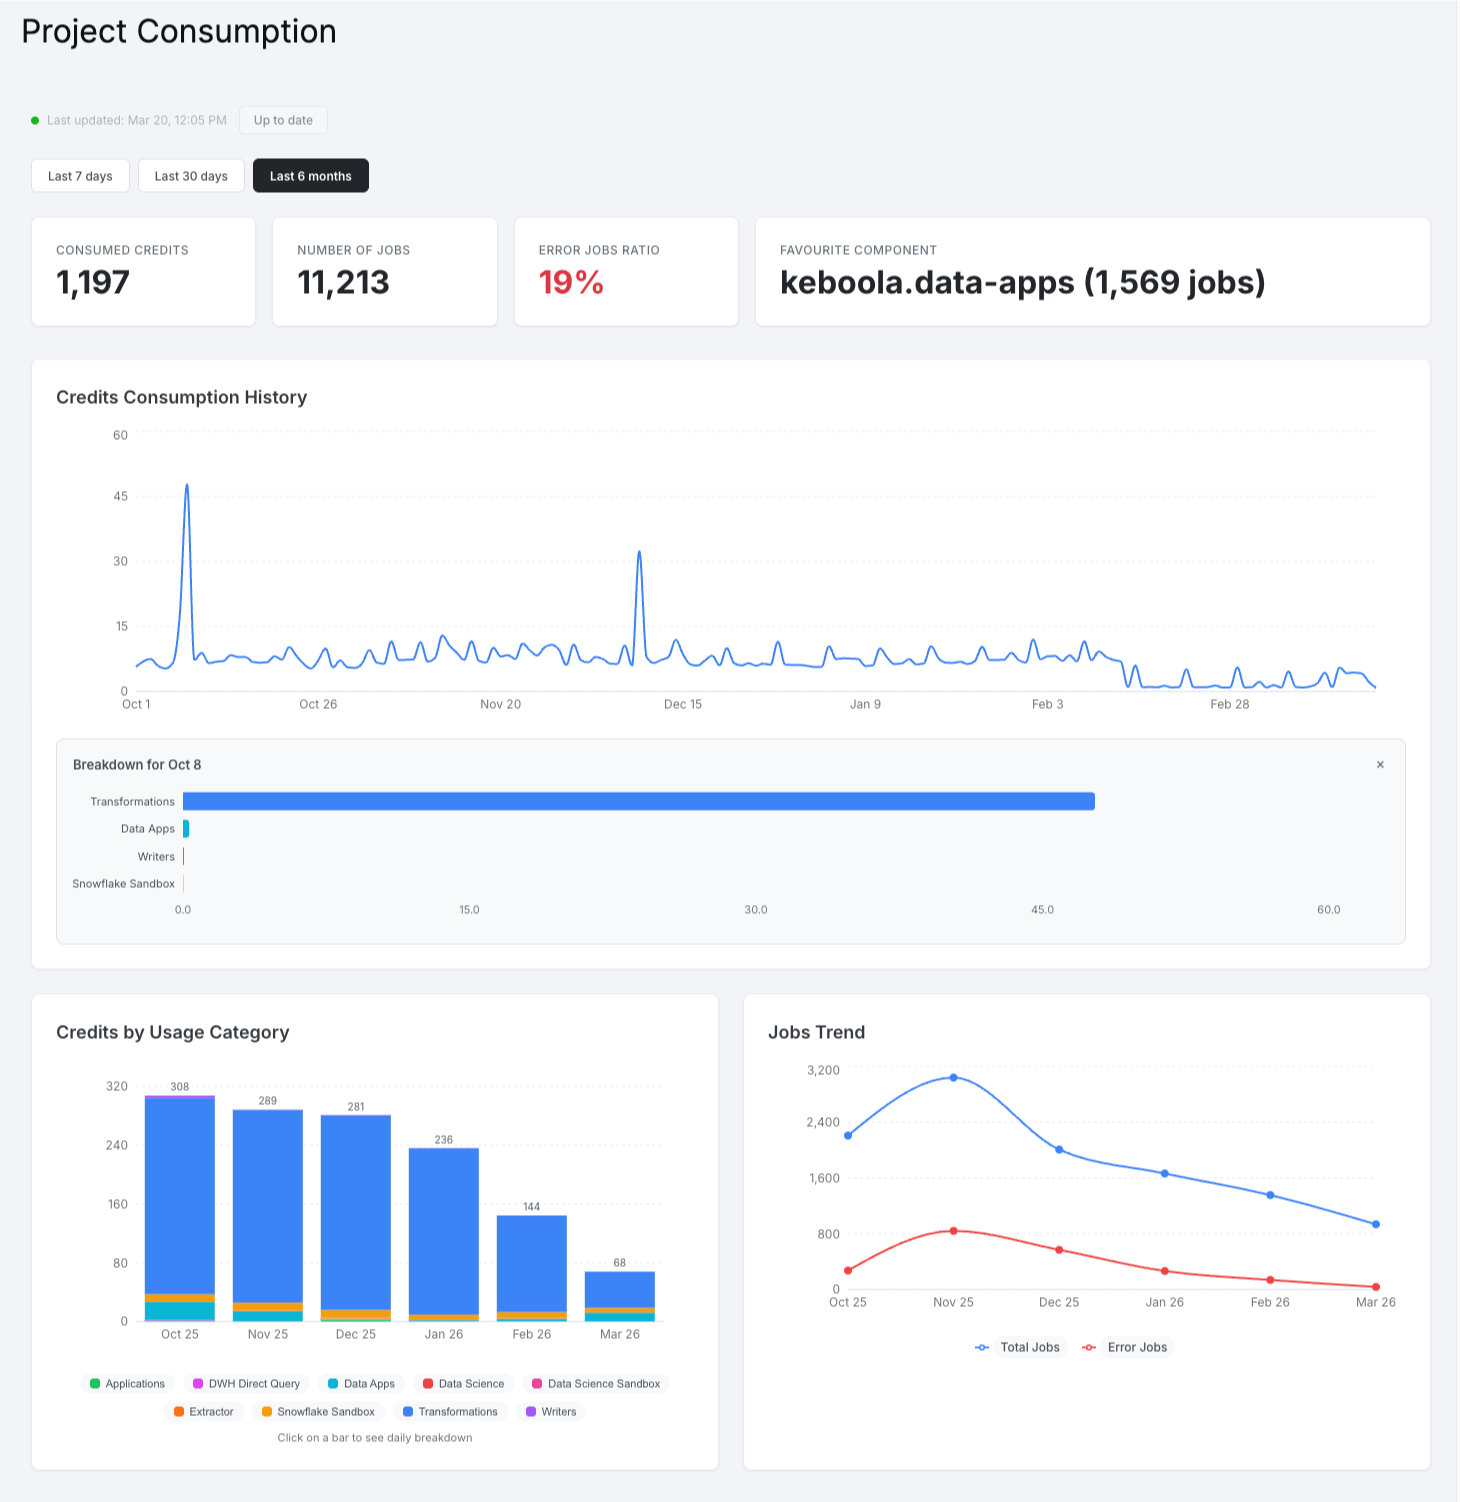
Project Consumption and Organization Usage dashboards have been rebuilt as well — Project Consumption with both credit-based (standard) and minute-based (Pay-As-You-Go) views, Organization Usage with contract consumption charts, top projects, top components, and monthly usage tables.
Under the Hood — How It Works
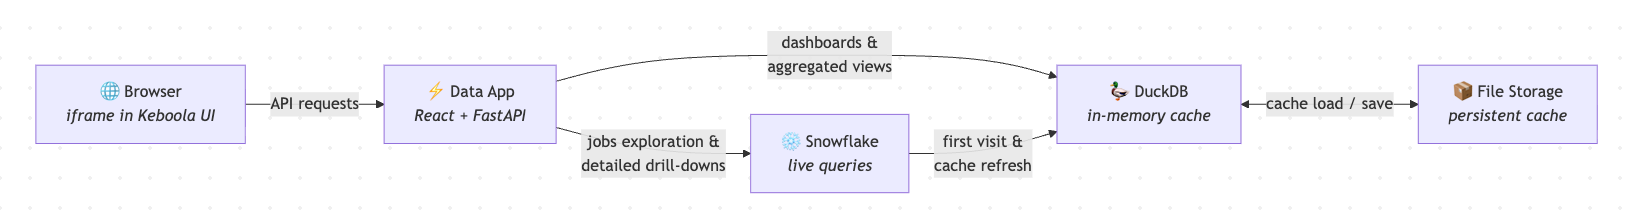
The dashboards are built as a React frontend with a FastAPI backend, packaged as a single Data App using the keboola/data-app-python-js image.
Data is served based on the user's authentication token — each user sees only the projects and organizations they have access to.
To keep the experience fast without running expensive queries on every page load, the app uses a hybrid model with DuckDB serving as an in-memory analytics engine:
- First visit — data is fetched from Snowflake and loaded into an in-memory DuckDB instance
- Cached — the DuckDB snapshot is persisted to Keboola File Storage for fast subsequent loads
- Smart refresh — the app monitors source data freshness and regenerates the cache in the background when new data is available
- Jobs exploration — for detailed job-level browsing with filters and pagination, the app queries Snowflake directly with server-side processing, using circuit breakers and short-lived caches to stay efficient
This hybrid architecture — DuckDB for aggregated views, live Snowflake queries for deep exploration — delivers sub-second response times for most interactions while keeping warehouse costs to a minimum.
What You Can Build with Data Apps
These telemetry dashboards are a real-world example of what's possible with Keboola Data Apps. If you're thinking about building your own:
| Capability | How we use it |
|---|---|
| React + any JS framework | Interactive charts with Recharts, client-side filtering and drill-downs |
| FastAPI backend | REST API with authentication, caching, and background processing |
| DuckDB in-memory | Sub-second analytical queries without warehouse costs |
| File Storage integration | Persistent caching across app restarts |
| Embedded in Keboola UI | Seamless iframe integration with token-based auth |
The keboola/data-app-python-js image gives you full control over both frontend and backend — bring your own framework, your own data logic, your own UX.
What's Next
We're already working on improving the Data App experience. One area we're actively investing in is faster app wake-up times. Data Apps sleep after a period of inactivity to optimize costs, and while they resume automatically when accessed, the first load after sleeping can take a moment. Our engineering team is working on reducing this wake-up time significantly — so opening your telemetry dashboards (or any Data App) feels instant, even after idle periods.
We Want Your Feedback
We're shipping this as a foundation, not a final product. We'd love to hear from you — not just about the dashboards themselves, but about how you think about telemetry data in the age of AI agents and automated workflows.
- Are static dashboards still the right interface for usage analysis?
- Would you rather ask questions about your telemetry data in natural language?
- What metrics or views are missing for your workflow?
Reach out through our support channel — we're listening.