Project Consumption Dashboard (Beta)
We are releasing a beta of a Project Consumption dashboard.
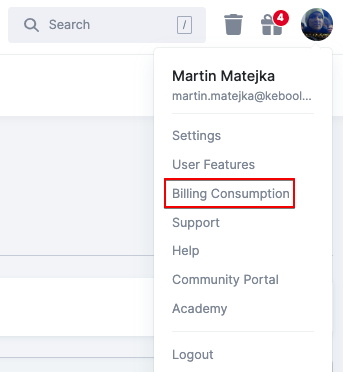
You can visit the dashboard directly in the Keboola Connection UI.
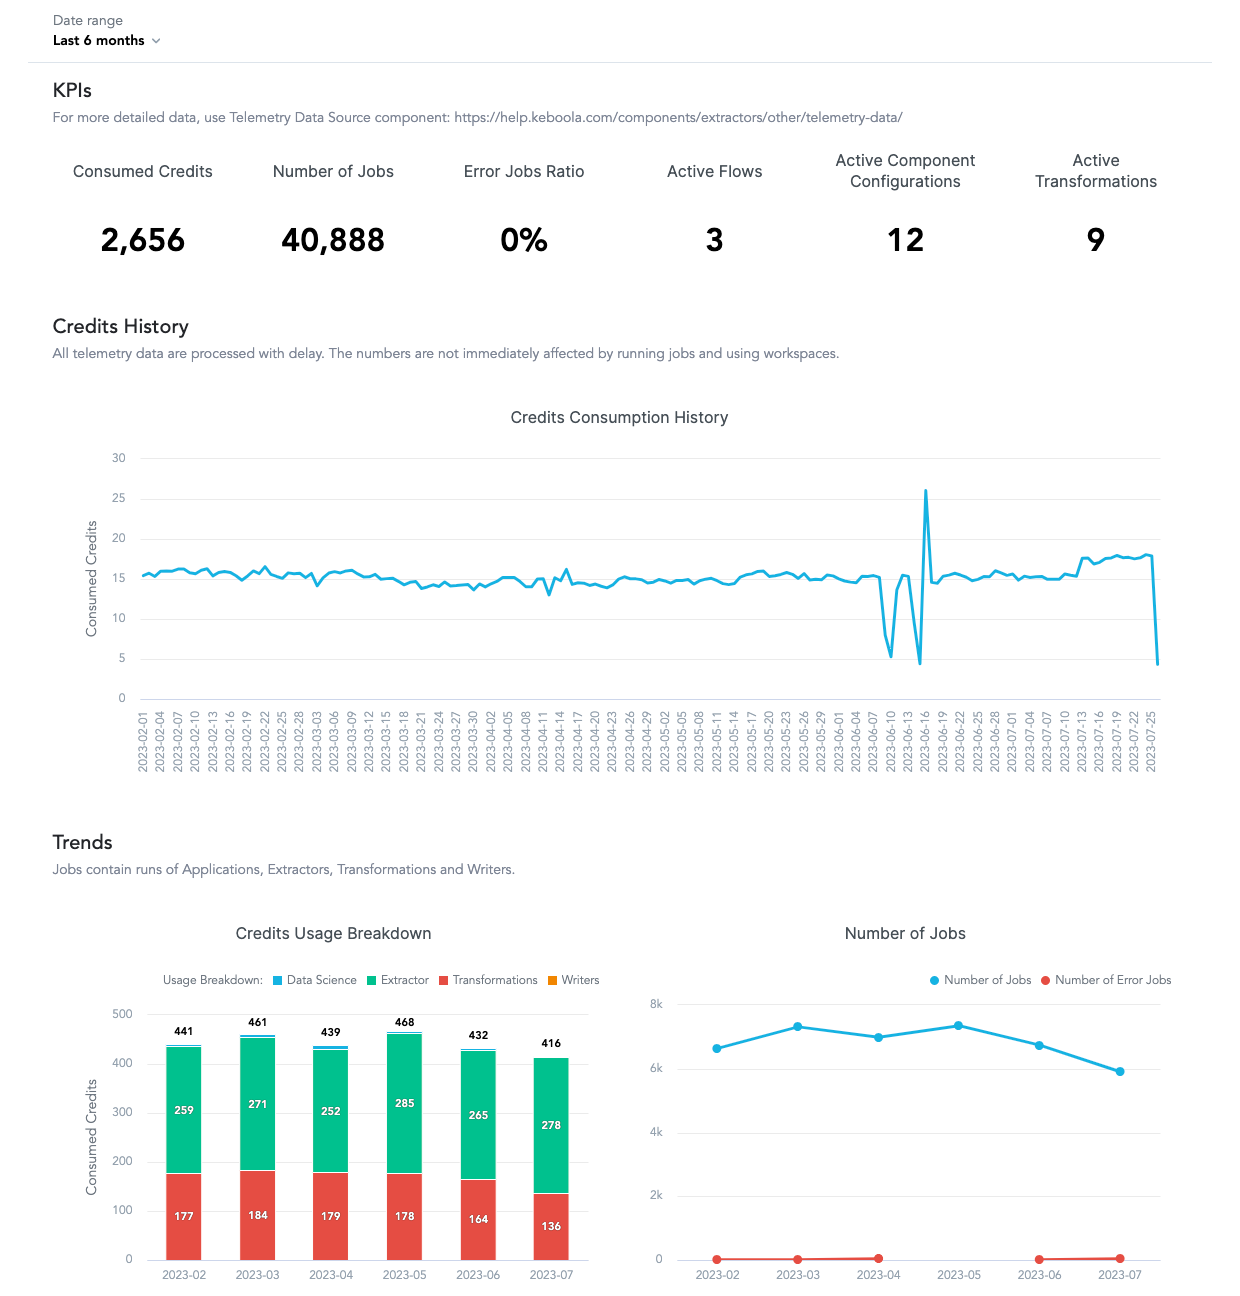
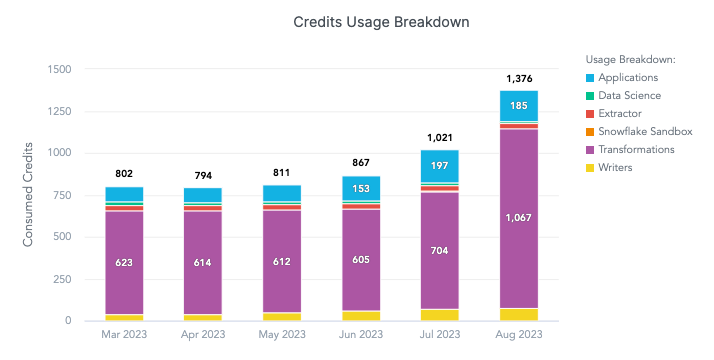
You can track credit usage and trends, check which types of components are consuming the most resources, and determine whether you are encountering too many errors when processing your data.
This simple dashboard should help you quickly analyze how well your project is performing. It is available in all our multi-tenant stacks and can be accessed from the top-right dropdown menu.
For further analysis, more detailed data are available via the Telemetry Data extractor. If you encounter any issues, please contact our support team and we will be happy to help you.
Future
We are working on a Consumption Overview dashboard, which will allow you to track the consumption of all your projects on a single dashboard, including contract limits, and allow you to predict their usage for the duration of your currently active contract. It will provide info at the level of the Telemetry Data extractor’s Organization mode. We'll tell you more once it's available.