MCP & AI Agent Activity Now Available in Telemetry Data
The Telemetry Data connector now includes the kbc_mcp_event table, giving you full visibility into how AI agents and MCP clients interact with your projects.
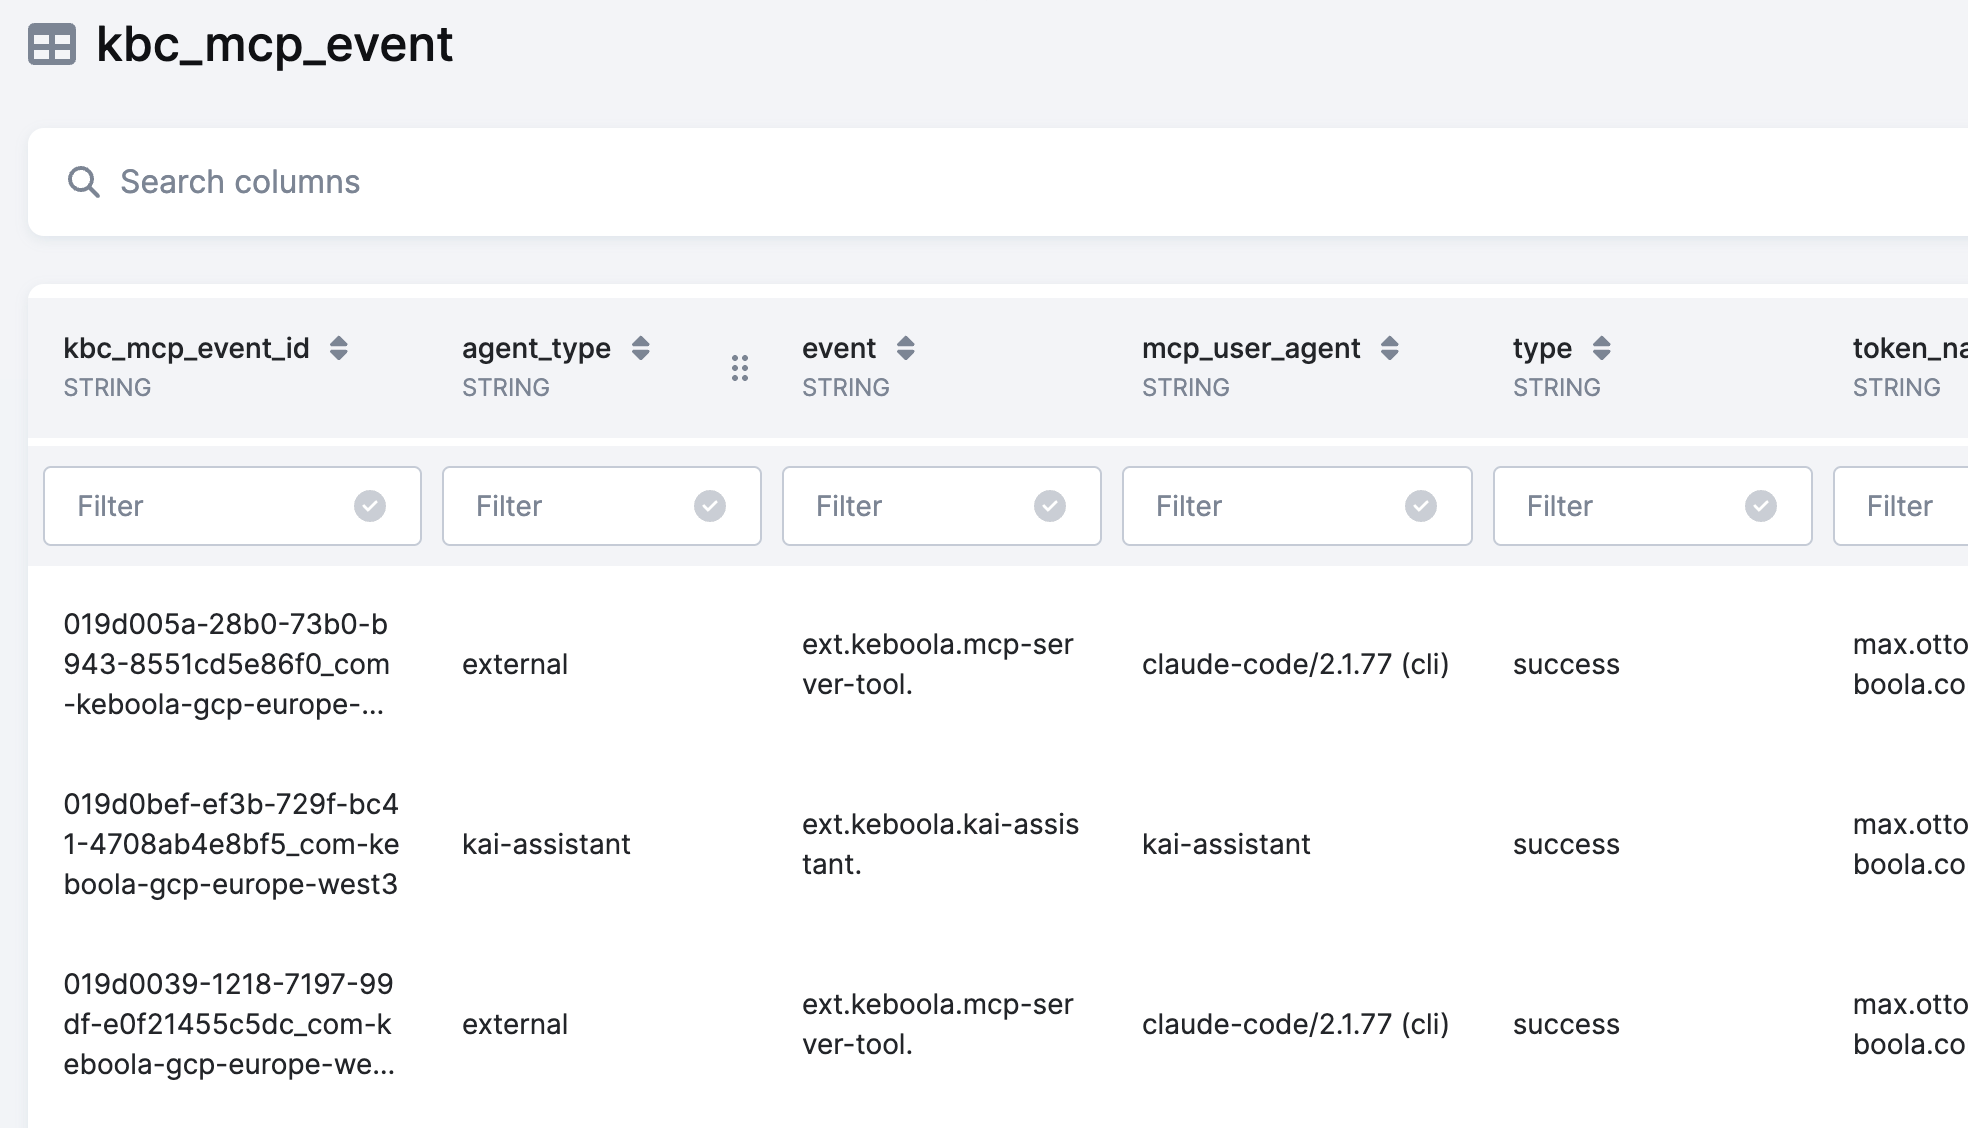
A new table, kbc_mcp_event, is now available in the Telemetry Data connector's Project mode. It captures every tool call made against your Keboola project through an MCP (Model Context Protocol) server — whether from Keboola's built-in AI assistants like Kai and AI Chat, or from external MCP clients such as Claude Desktop, Cursor, or Devin.
What you can track
Each row in the table represents a single tool invocation and includes:
- Who made the call — token, user identity, and agent type (
kai-assistant,ai-chat, orexternal) - What was called — the specific MCP tool (e.g.,
query_data,create_sql_transformation) along with its input arguments - How it went — success or error outcome, duration, and the full error message for failed calls
- Where it came from — the MCP client environment, server version, and conversation session ID
Why it matters
As AI-assisted workflows become a bigger part of how teams use Keboola, understanding that activity is essential for governance and optimization. With this data, admins and project managers can:
- Monitor AI adoption across projects and teams
- Analyze error rates and identify failing tool calls
- Understand which MCP tools drive the most activity
- Distinguish between internal agent usage and external client access
- Track conversation-level patterns over time
The table is available now in the Telemetry Data connector. Simply run an extraction in Project mode to start collecting MCP event data. For full column descriptions and examples, see the Telemetry Data documentation.